Home » Blog » Manage your zipBoard Projects in Microsoft Team, Import Issues in CSV, and Improved reporting
zipBoard features update
In our constant effort to update zipBoard to make it more feature-rich and easy to use, we have added some new integrations and features. These features are developed keeping in mind how teams with big size projects need features to manage development projects effectively. With this update, you can view and manage your zipBoard projects in Microsoft teams, import issues from other systems, and experience improved reporting of various metrics.
Integrate zipBoard with Microsoft Teams
Due to its wide use in remote teams and many companies switching to Microsoft teams as their primary project management and communication tools, we understood that it was the need of the hour to provide our family of users with Microsoft integration.
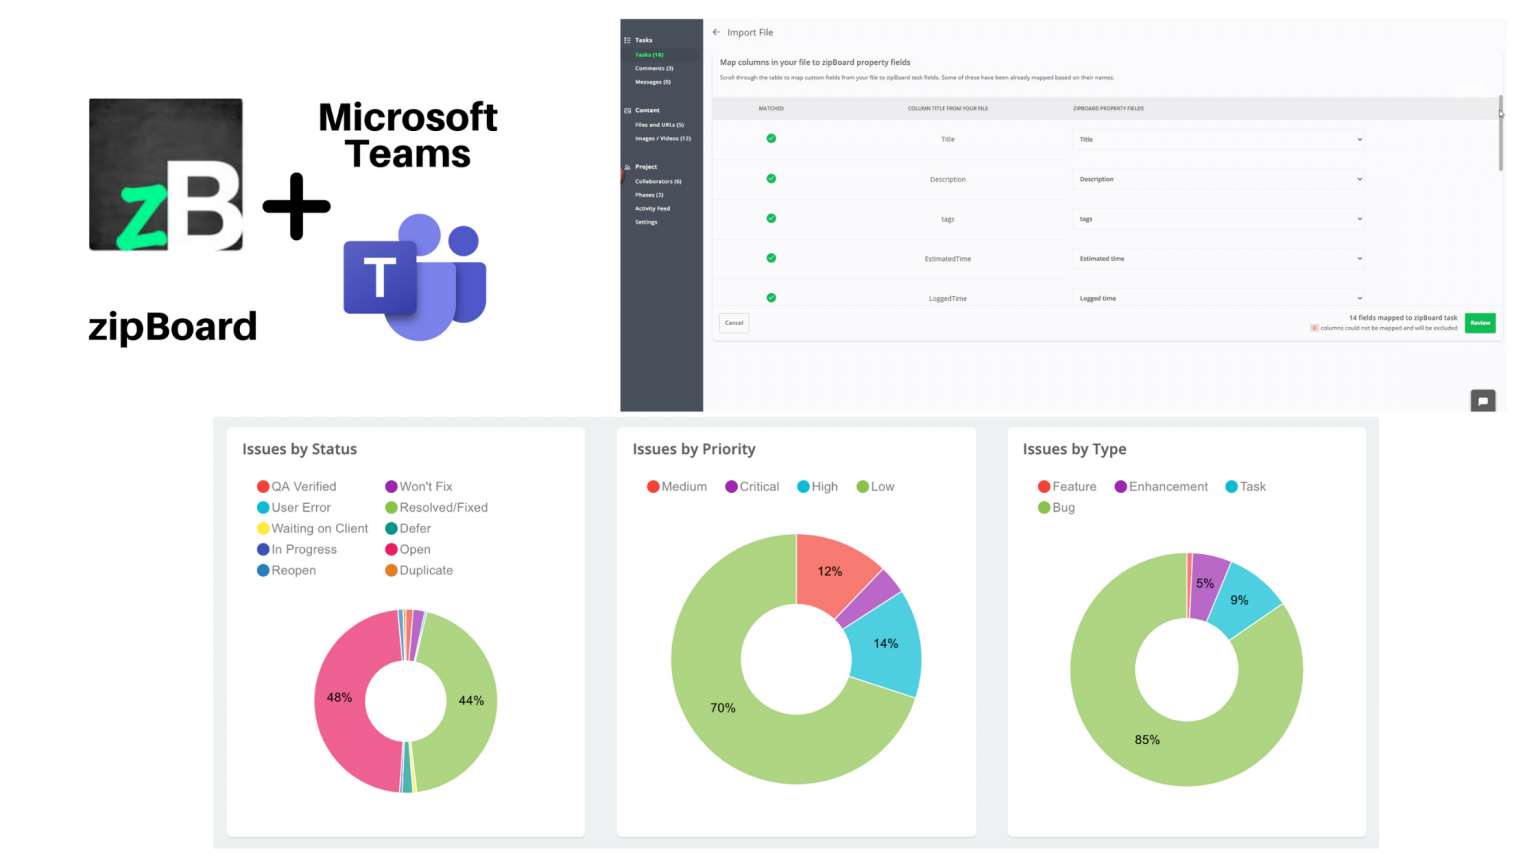
With teams integration, your team members can easily track issues, view feedback and comments from your zipBoard project. No need to leave the teams app to check the status of your project. Check details of your zipBoard projects directly from the teams app.
Import tasks using CSV to your new or existing projects
We love the freedom of being able to switch between apps and migrate all tasks and data to a new app without any hassle. zipBoard in the past allowed you to be free to be able to export all your tasks in a downloadable CSV file, which you could then add in other tools in case you used one for managing projects, but what if you wanted to do vice versa.
Now with the recent update, you can easily import all your tasks from other systems or tools using the Import CSV file. This makes migration easy for anyone who is looking to migrate to zipBoard from other bug tracking or visual review software. Or let’s say you have a CSV file with tasks related details that you want to add into zipBoard.
To import your tasks all you need to do is simply choose the CSV containing the data upload it, zipBoard will map the data with the zipBoard field or you can even manually custom map the data, review if all looks good in preview, and click “complete and tasks” and voila all your tasks are now imported in zipBoard.
Improved Reporting - Visualize project performance over time with project and org level reports
Are you a fan of visual representation of project-related details in charts and graphs as we are. Then this update is going to bring a smile on your face.
We have worked hard to make the job of managing projects, track task details, timeline, workload, expected ETA, etc. It is necessary to understand whether the project is progressing as per the project roadmap, tracking all the data using just numbers gets the work done. But it might be a cumbersome process. However, that is not the case with charts and graphs, our enhanced reporting system now has visual charts and graphs. Now you can get reports on;
Number of issues created over a period of time.
Number of feedback received.
Number of issues based on priority, status, and assignees.
You can also view reports in different timelines and download them into a PDF to share with others.
Reports are in beta and accessible only on request. Send a message to our support to request access. Please note, reports can now be added to all plans at an additional cost.